Time-Travel Debugging: A Playwright Traces Tutorial
Learn Playwright traces for faster CI debugging. Step through failures, inspect changes, and fix tests with confidence.

Ever wished you could replay a test that failed in your CI? That's where Playwright Traces come in! This guide shows how it seamlessly fits into your CI workflow, making bug-hunting easier and more effective.
Debugging Trace in Action
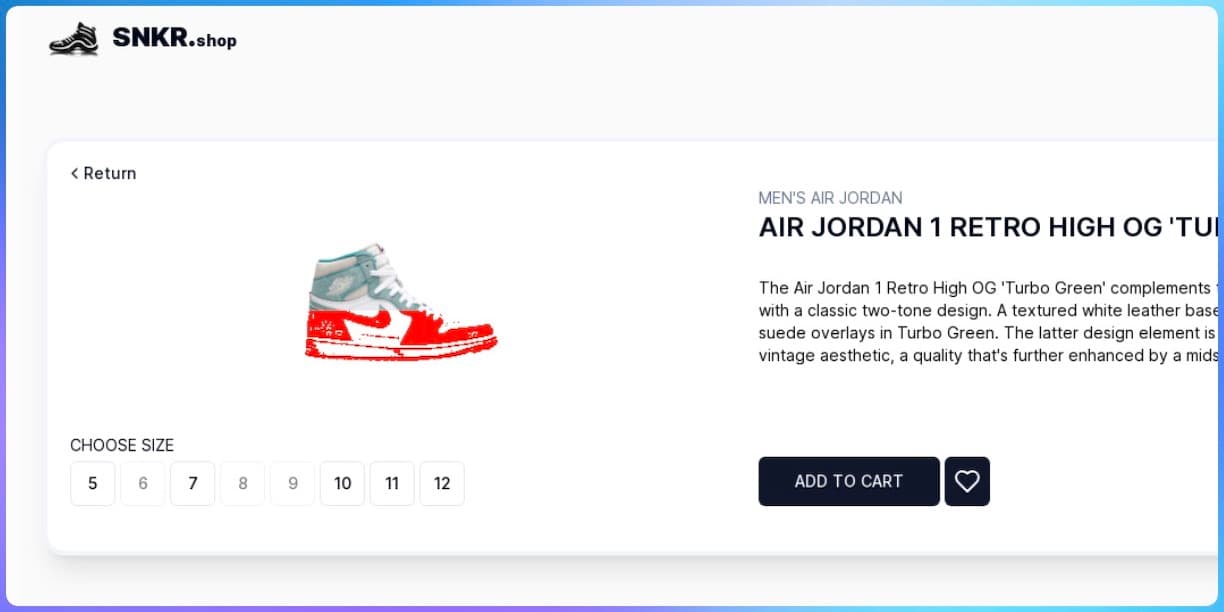
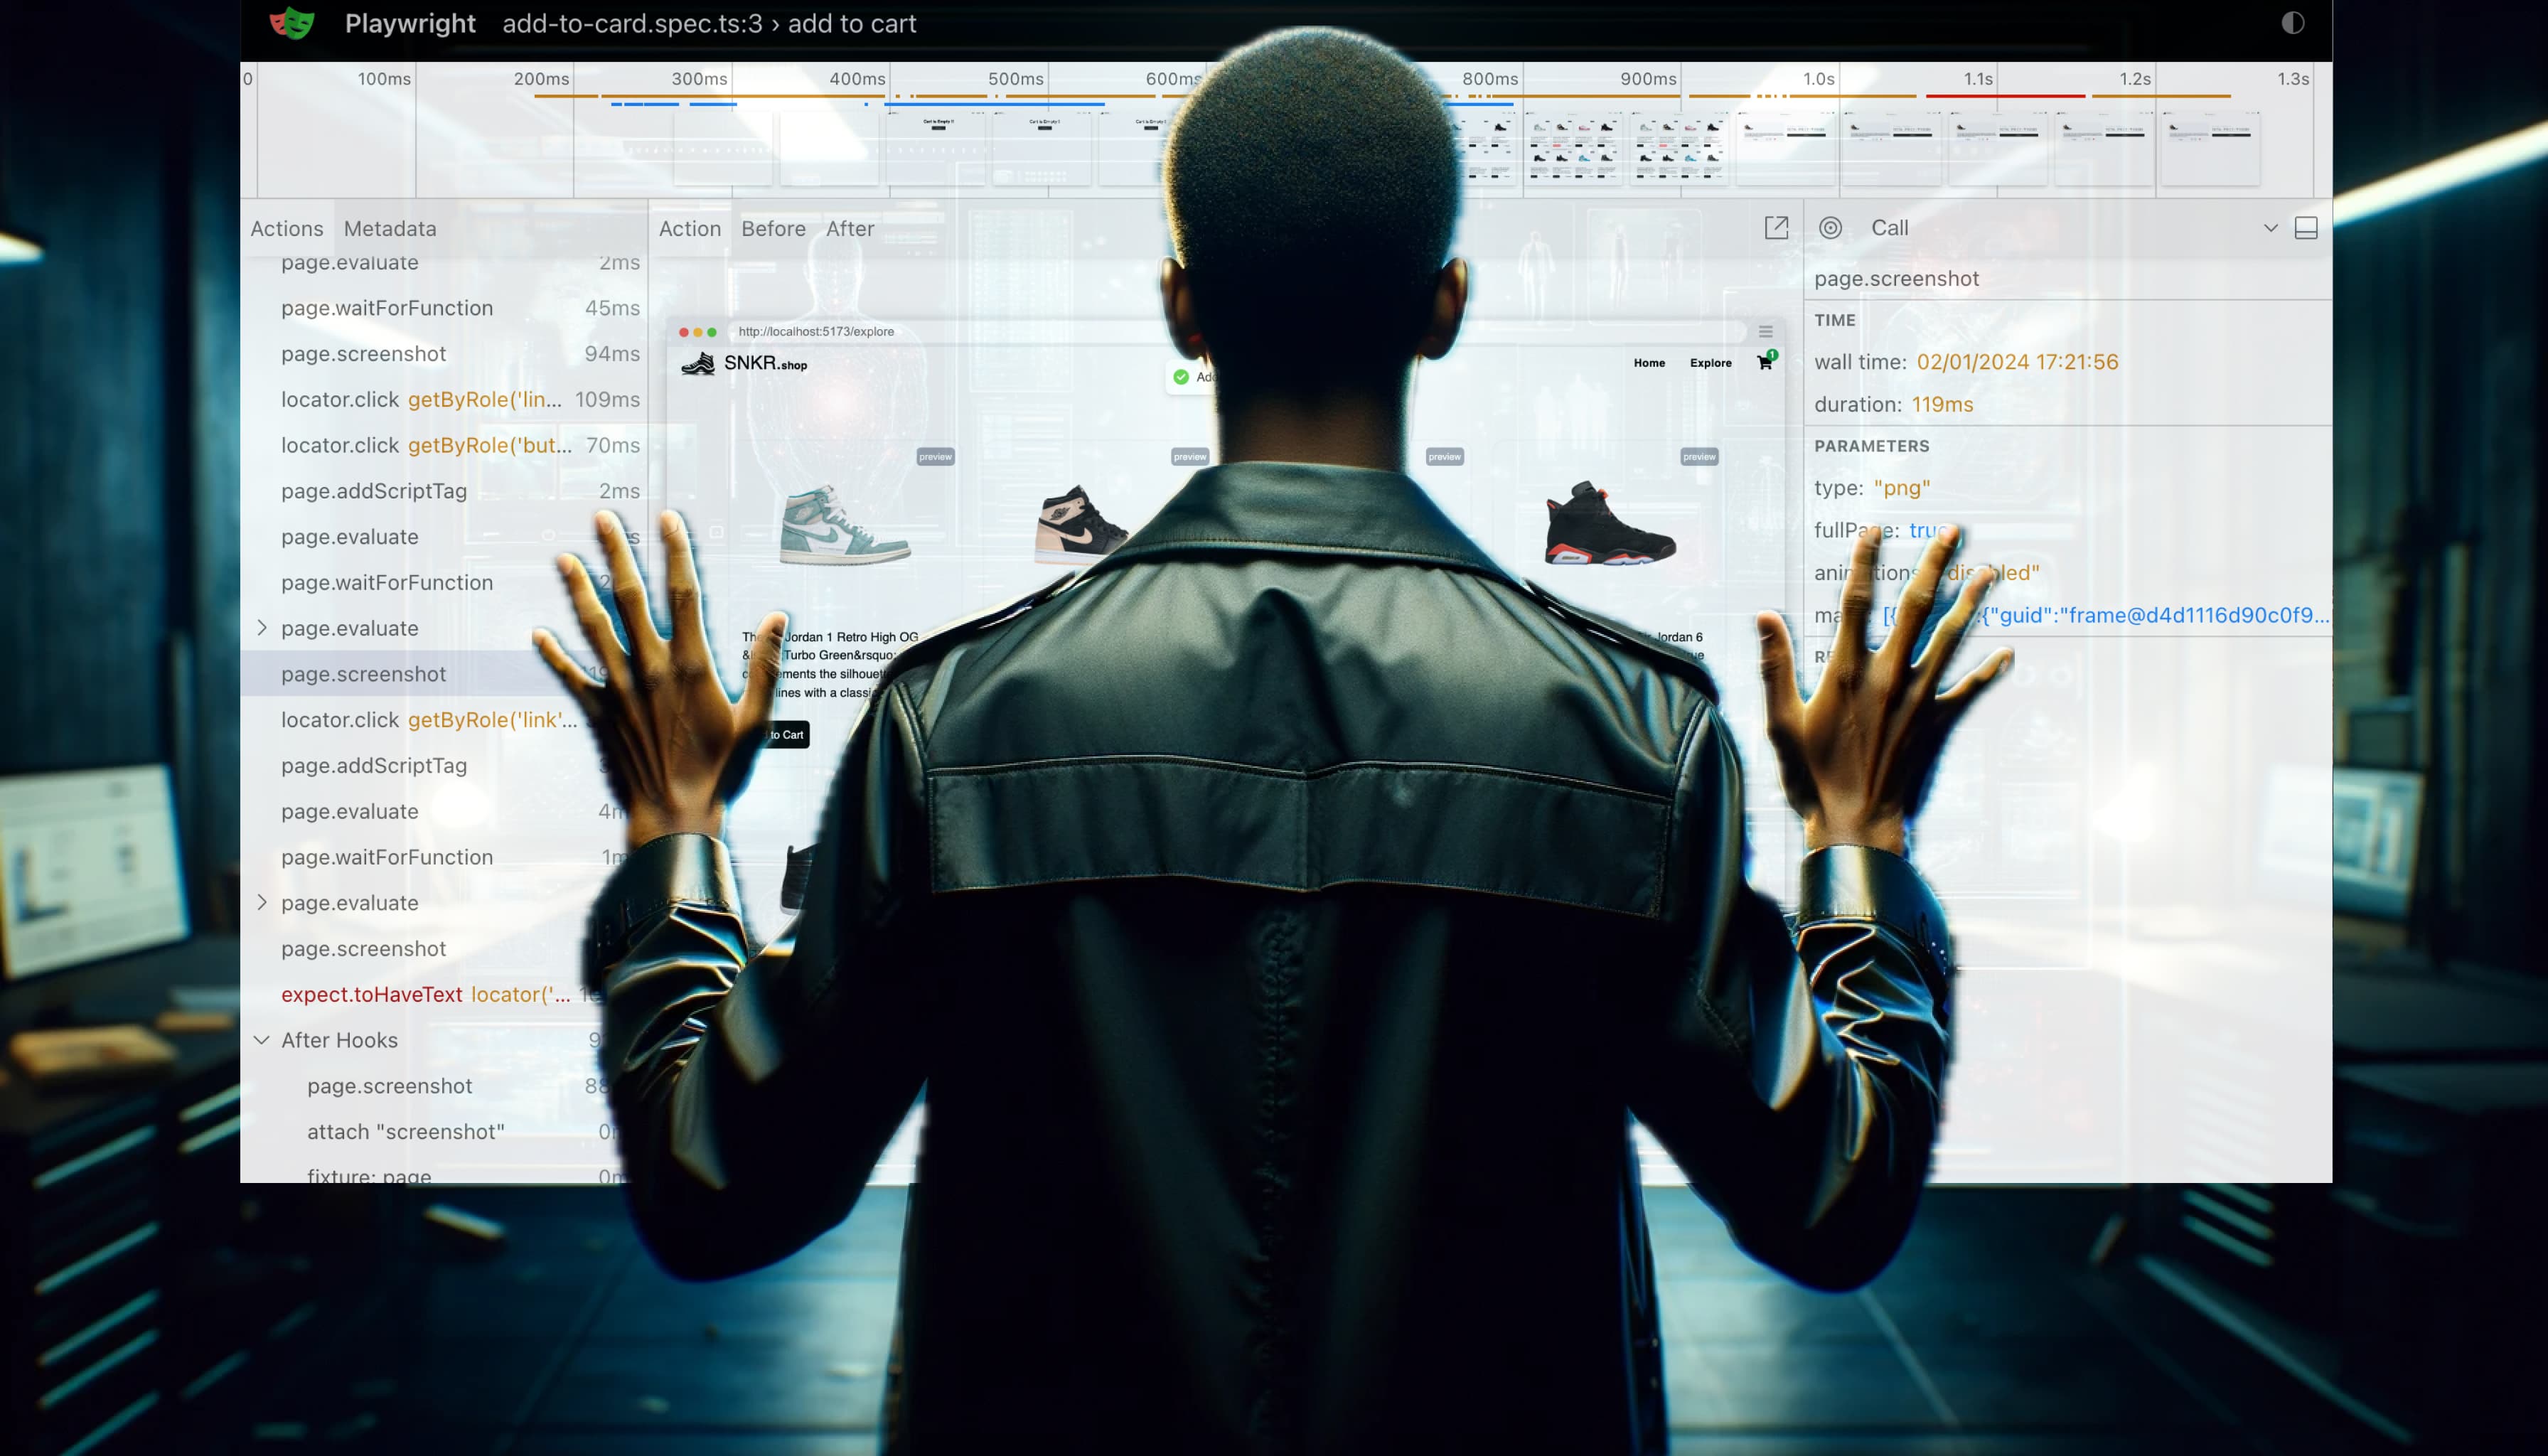
Let's jump right into a practical scenario. In the video below, I'll show how to use the Playwright Trace Viewer to inspect a failed test, identify the issue, and apply a fix.
In this video, I focus on resolving a complex locator issue. Besides this, Playwright Trace Viewer offers an extensive array of features for pinpointing test failures, including network logs, and console messages or step-by-step snapshots, not covered here.
Integrating with Your CI
1. Record Traces when a Test Fails
To automatically record traces on your CI, simply update your Playwright config file with this option:
use: {
  trace: 'on-first-retry',
}
Now, whenever a test fails, a trace file is generated, ready for download or online viewing with a third-party reporter.
2. Open Trace Files
To open a Trace file, either upload it to trace.playwright.dev or run the command:
npx playwright show-trace <TRACE_FILE_PATH>.zip3. Third-Party Reporting with Argos
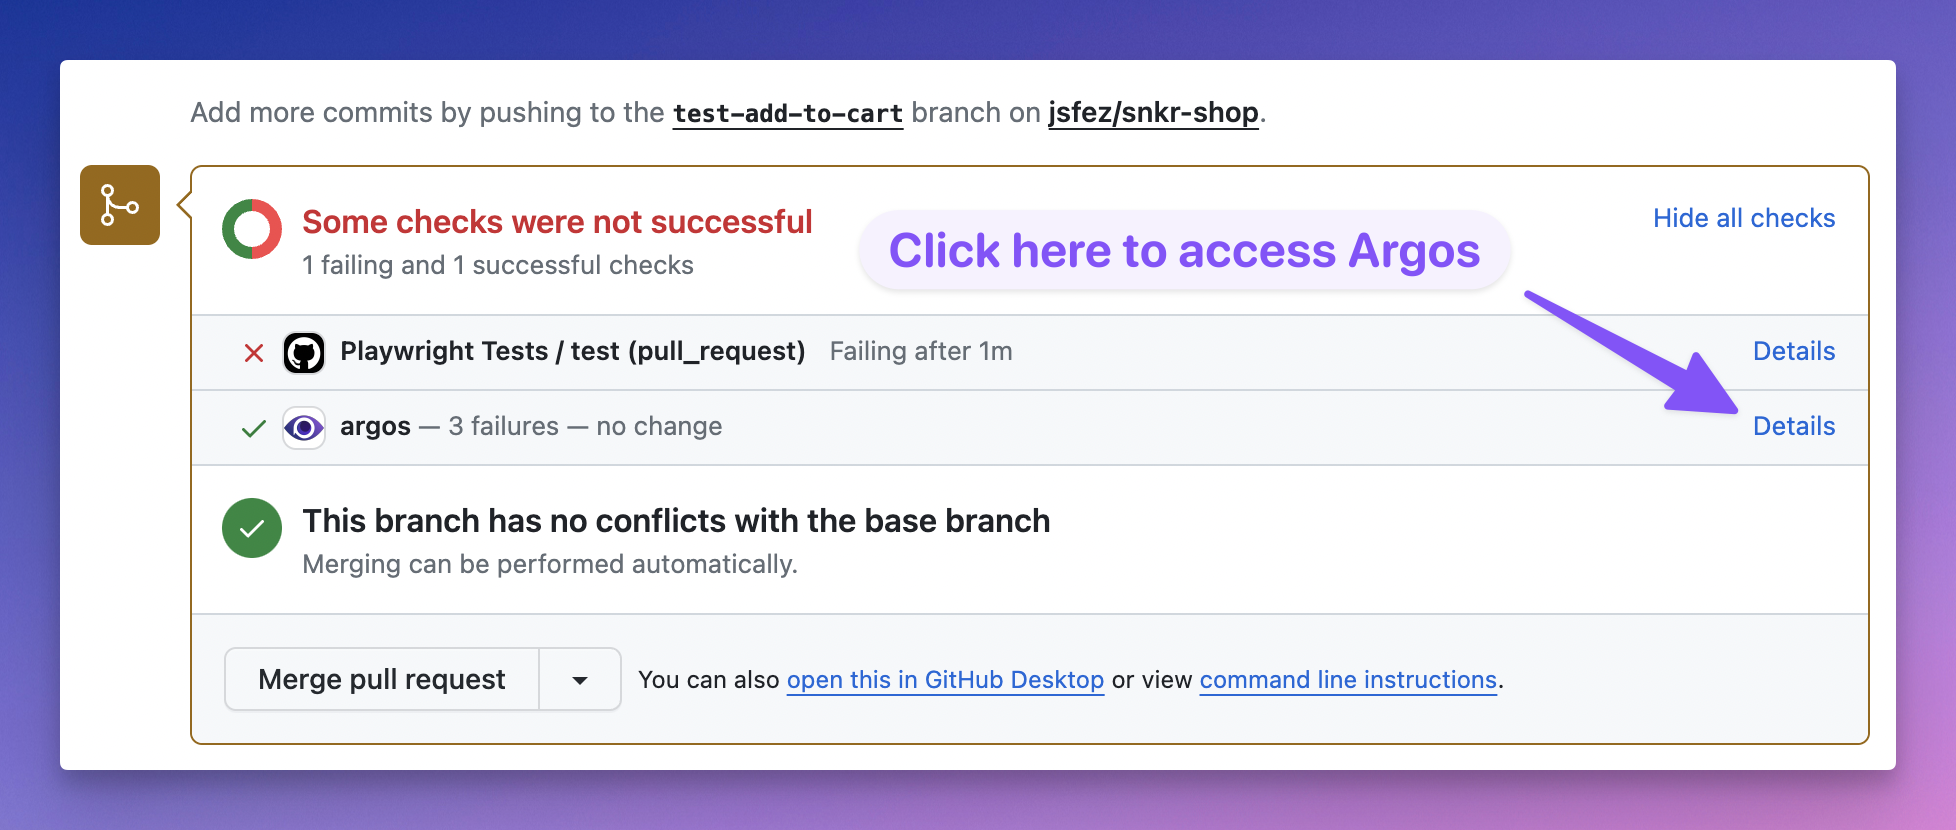
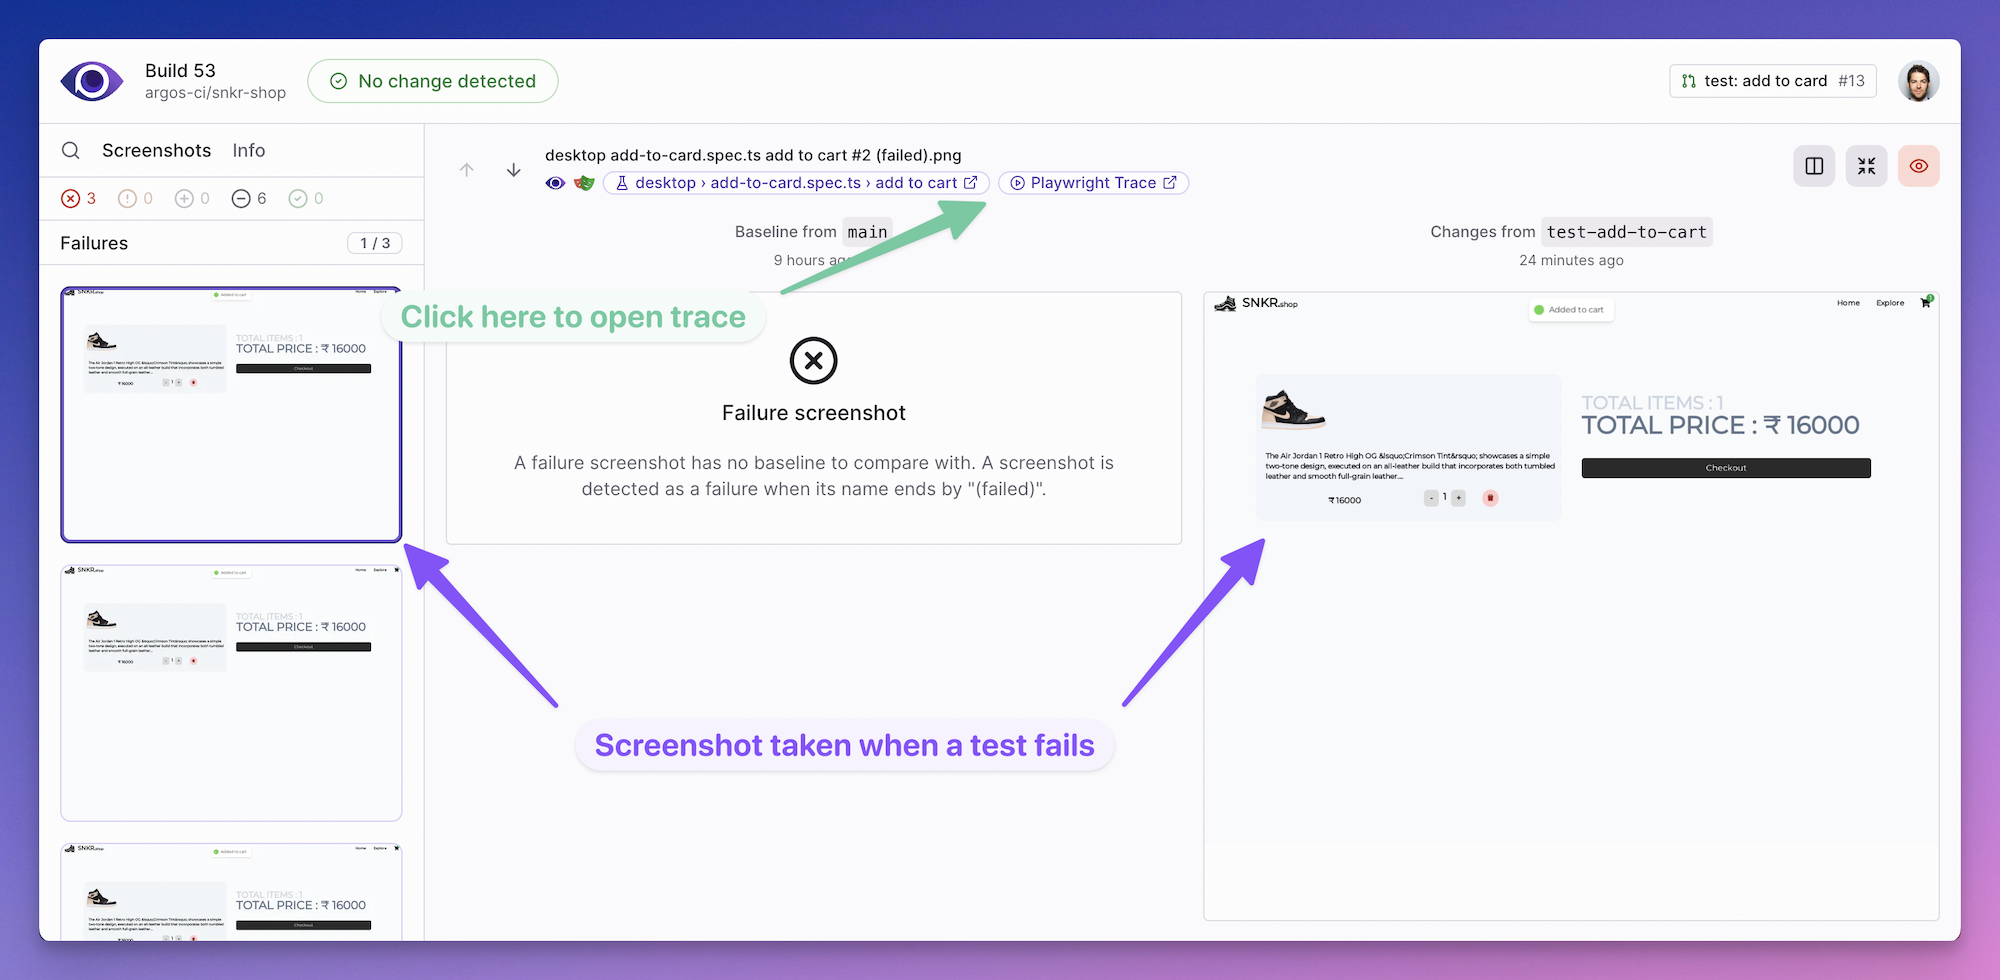
To enhance your workflow, you can integrate your CI with Argos for direct access to Playwright Traces online. This seamless connection eliminates the need to download trace files, offering a more streamlined approach.
Check out the Argos Playwright setup guide for easy integration steps.