Tests Dashboard
The Tests dashboard gives you a project-wide view of test stability. It lists all tests sorted by flakiness score so the most flaky tests show up first.
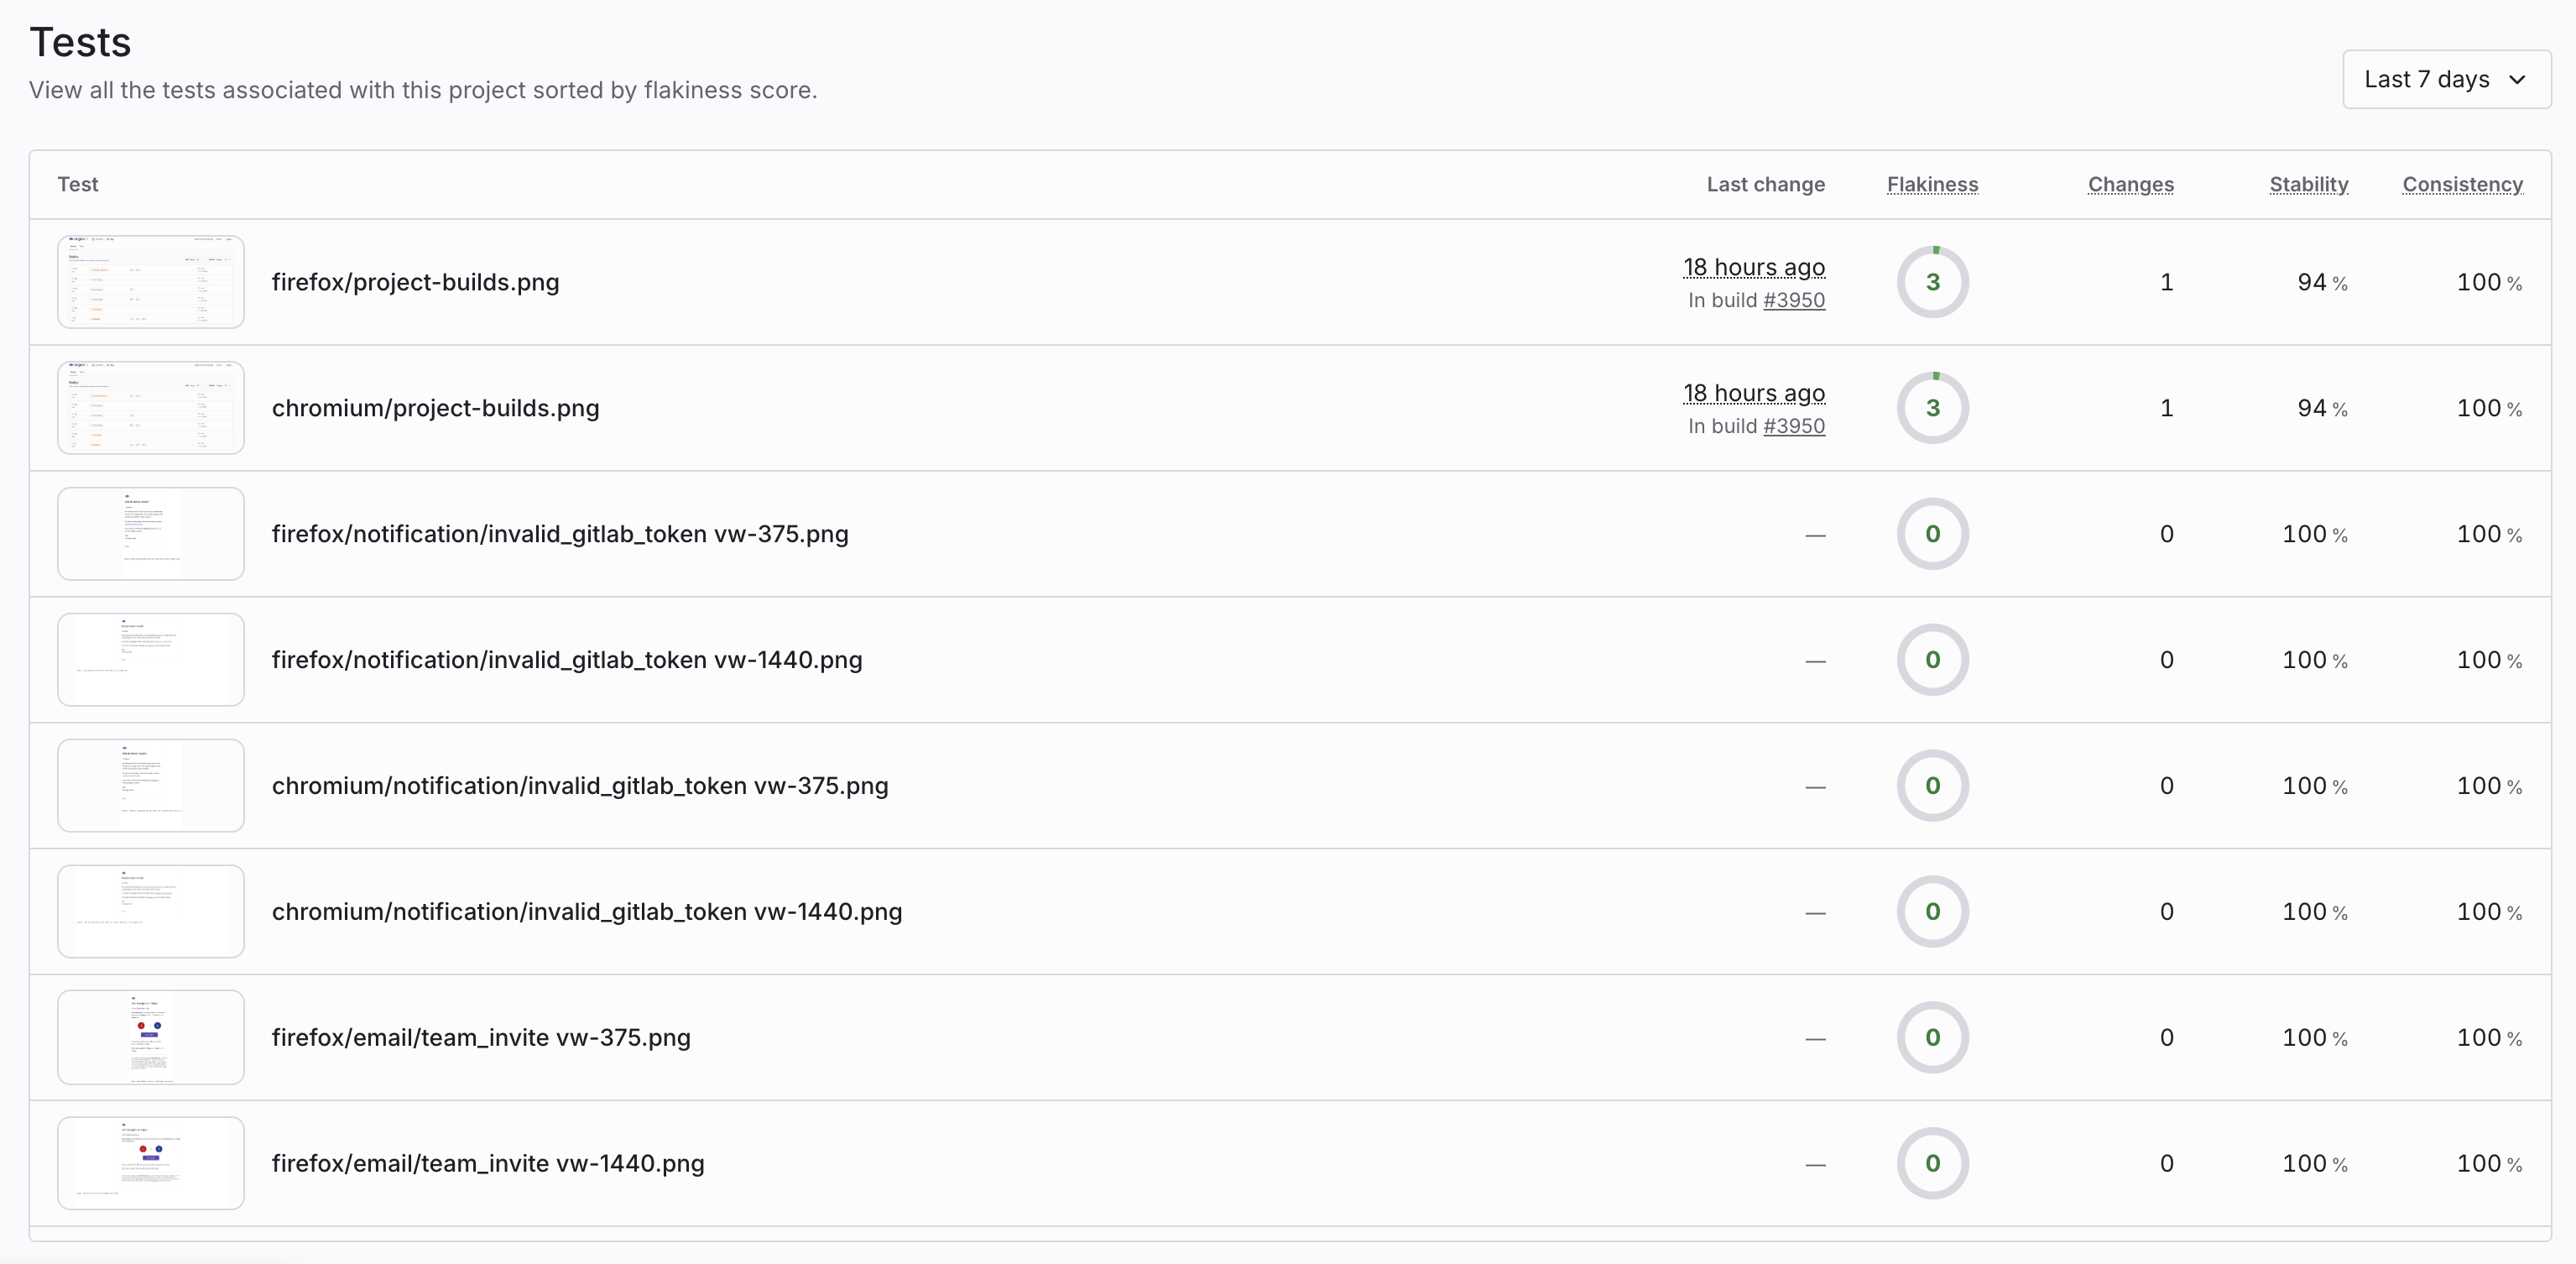
A project Tests dashboard with flakiness metrics
Open the dashboard
- Open your project in Argos.
- Click the Tests tab.
How tests are ranked
Tests are sorted by flakiness score (descending). The tests at the top are the most flaky.
Columns explained
- Test: The latest screenshot uploaded for the test, the test name, and the build name.
- Last change: The most recent change detected on an auto-approved build during the selected period.
- Flakiness: A score that summarizes how flaky a test is based on its stability and consistency.
- Changes: The number of changes detected for the test during the selected period.
- Stability: The ratio of changes to total reference builds. A lower stability rate means the test is more likely to be flaky.
- Consistency: The ratio of one-off changes to total changes. A lower consistency rate means the test is more likely to be flaky.
Filter and time range
- Filter tests by build name to focus on a subset of runs.
- Choose a time period to control which changes and scores are included.
Open a test page
Click any row to open the detailed test page and review history and stability details. See Flaky Test Detection for more information.