Analytics revamp
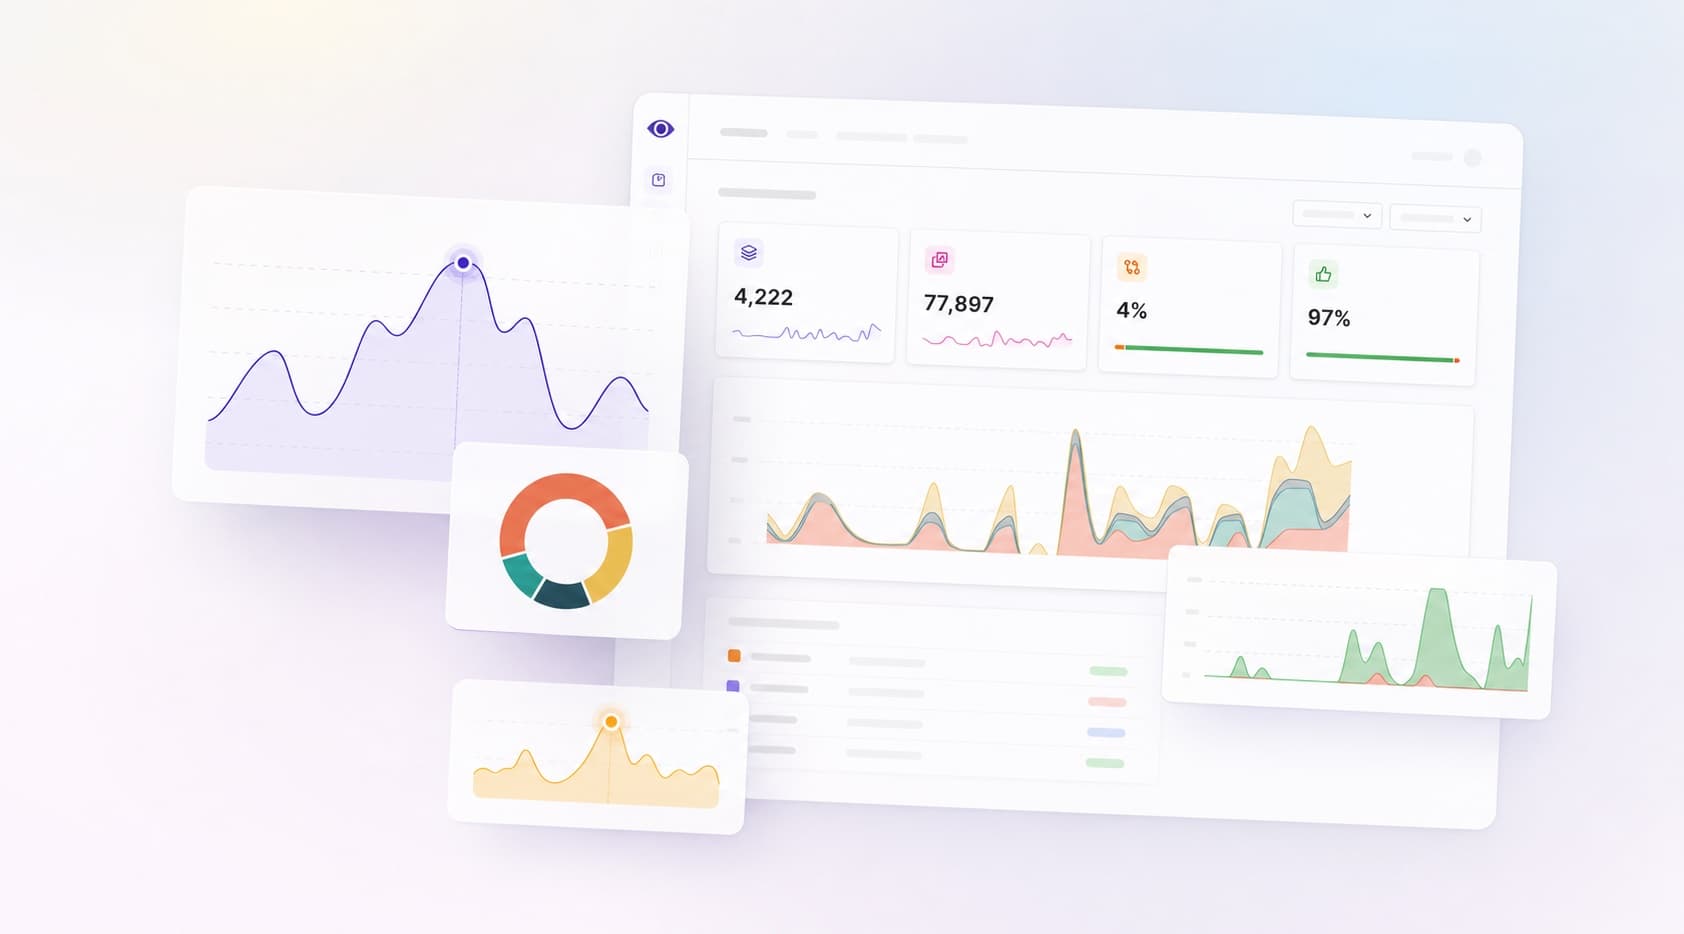
Analytics used to tell you how much you tested. Now it tells you how visual testing is going. The account analytics page has been redesigned around a scan-then-explore hierarchy: a KPI band answers the big questions at a glance, and themed sections let you dig into where activity, changes, and reviews concentrate — across every project in your account.
- Four KPIs at a glance — Builds and Screenshots with trend sparklines, joined by two new rates: Change rate, the share of builds where Argos detected changes, and Approval rate, the share of reviewed builds your team approved.
- Build outcomes — follow changes detected vs. no changes and approvals vs. rejections over time, rendered in the same status colors you know from builds.
- Activity and breakdown by project — builds created and screenshots captured per project, a screenshots-by-project donut, and screenshots per build.
- Richer CSV exports — every chart exports its underlying data, and builds now include changes detected, no changes, approved, and rejected columns.
Scope the whole page to the projects you care about, pick a preset period — 7, 30, 90, or 365 days — or set a custom range, and group data points by day, week, or month.
Analytics in the API and CLI
For the first time, your metrics are available outside the app. The new GET /accounts/{accountSlug}/analytics REST endpoint returns the same build and screenshot metrics that power the dashboard, and the CLI wraps it in a single command:
argos analytics --account my-team --from 2026-01-01 --group-by weekYou get totals and a per-period series for builds and screenshots — including build outcomes — broken down by project. Add --json when a script, a dashboard, or an AI agent needs to parse the result.
Learn more in the analytics documentation, or explore the analytics endpoint and the argos analytics CLI command.